FEATURES · HOW IT WORKS

Four parts, one time axis.

A small library on the microcontroller, ready-made firmware to start from, a desktop app that receives and checks everything, and a Python sender for the PC side. Here is what each part does and how they talk to each other.

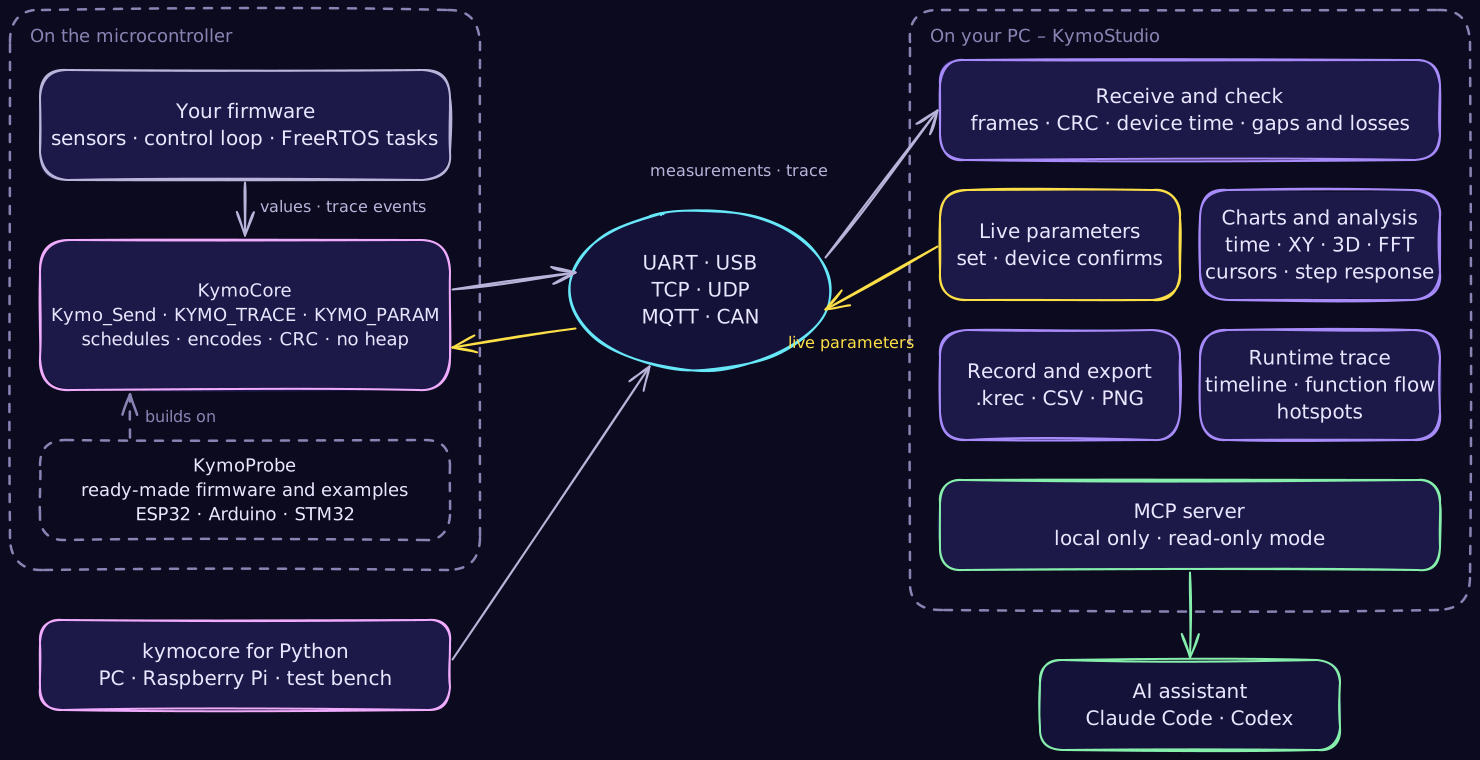
Kymotrace system overview: on the microcontroller your firmware feeds values and trace events into KymoCore; KymoProbe provides ready-made firmware built on KymoCore; kymocore for Python sends from a PC or Raspberry Pi. Data travels over UART, USB, TCP, UDP, MQTT or CAN to KymoStudio, which receives and checks frames, draws charts, records, shows the runtime trace and sends live parameters back to the device. A local MCP server lets an AI assistant such as Claude Code or Codex read the data.
Measurements and trace travel to KymoStudio; live parameters travel back. Everything stays on your machine.

The parts

You only need KymoStudio to start. The other parts come in when you want device time, trace or live parameters.

On the microcontroller · MIT

KymoCore

A portable C library with a C++ wrapper. You describe your channels, call Kymo_Main() in your loop, and KymoCore decides which value is due, stamps it with device time, encodes a compact frame with CRC and hands the bytes to your transport.

  • No heap, bounded work per call, no hardware drivers inside
  • Optional: runtime trace (KYMO_TRACE) and live parameters (KYMO_PARAM)
  • Arduino, ESP32, STM32 and anything with a byte-wise interface
KymoCore →

On your PC · free for makers

KymoStudio

The desktop app for Windows and Linux. It reads serial, TCP, UDP, MQTT and CAN, checks every frame and tells you openly where the time comes from and whether anything was lost.

  • Time series, XY and 3D, cursors, FFT, step response
  • Runtime trace, function flow and hotspots
  • Recordings, CSV and PNG export, live parameters, MCP for AI assistants
KymoStudio →

Starting point · MIT

KymoProbe

Ready-made PlatformIO firmware built on KymoCore. Flash it, see test signals within minutes, then replace them with your own sensors. Also contains the ESP32 trace demo, the stack reserve example and the PI controller for live parameters.

KymoProbe →

PC side · MIT

kymocore for Python

The same protocol from Python: send values from a Raspberry Pi, a test bench script or a simulation over UDP, TCP, serial or MQTT. Firmware and PC script then share one time axis in KymoStudio.

kymocore for Python →

The path of one value

From the sensor reading to the chart – and what is checked on the way.

  1. 1 · deviceSample and stampYour callback returns the value. KymoCore adds the device time in µs or ms, so jitter on the cable does not distort the curve.
  2. 2 · wireFrame with CRCOne measurement takes 9 to 21 bytes, depending on axes and timestamp. The interface takes them piece by piece if needed; KymoCore never waits for it.
  3. 3 · KymoStudioCheck and showEach frame is checked, gaps and losses are counted, the raw values are kept. Charts, analysis and export all work on these raw values, not on the screen.

Do I need the library?

Path A · no library

Keep your Serial.print

Serial.printf("temp=%.2f hum=%.1f\n", t, h);

KymoStudio reads Teleplot, CSV and name=value lines. The time is the time of reception on the PC – good for trying it out, honest about its limits.

Path B · KymoCore

Device time, trace, parameters

With KymoCore every value carries the device's own clock, losses become visible, and you can add runtime trace and live parameters to the same connection.

Firmware & protocol →

Typical setups

Try it without hardware first.

KymoStudio has a built-in demo source. When you are ready, flash KymoProbe.